Don’t Feed the Trolls has been released for more than two months now, and revenue is slowing down. I think it’s a good time to look at how much money the game made.
The game and the business model
Don’t Feed the Trolls is an arcade reflex game released on Google Play on May, 3rd, on Apple App Store on May, 17th and on Amazon App Store on May, 31st. The game is free to download and contains ads (AdMob).
On Google Play and iOS, the player can unlock the full version (removes ads, adds two game modes and levels) with a $0.99 in-app. Once purchased, another in-app called “Gold Pack” is available for players to have their name appear golden in the leaderboards. Basically, this “Gold Pack” is made for the players willing to support us with an additionnal purchase of $1.99. I decided to add this “Gold Pack” because I wanted to price the full version $0.99, but I think it’s worth a bit more than that ;).
On the Amazon App Store, the game is free with ads, there is no in-app and no way to remove the ads. I didn’t implement in-app because Amazon only pays the developers with checks, in US dollars, and French banks charges so much for that that it’s not worth it. Also, it required a lot of code to replace Google Play in-apps and to integrate Amazon SDK. I can’t test on a real device as Kindle Fire are not available in France for now.
The raw stats
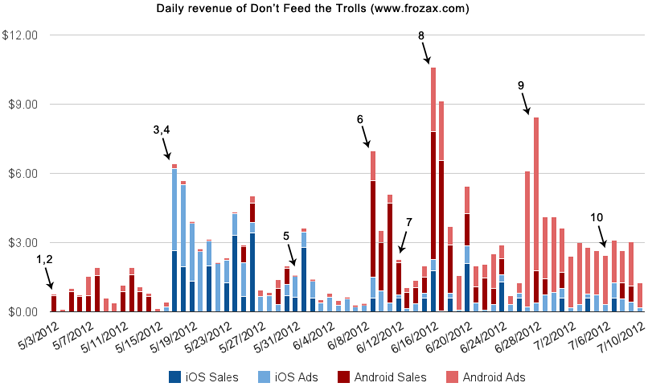
Here is the chart with net revenue per day (after Apple/Google’s cut). iPhone/iPad revenue is blue, Android (Google Play and Amazon) revenue is red. Dark colors are sales revenue, light colors are ads revenue (click to enlarge).
If you take some time to look at this chart, it’s pretty easy to read. You can see I added black numbered arrows for specific events, here is the legend:
- Release of Don’t Feed the Trolls on Google Play (Android)
- Contact many Android-only press/review sites
- Release of Don’t Feed the Trolls on the App Store (iOS)
- Contact many multiplatform and iOS-only press/review sites
- Release of Don’t Feed the Trolls on Amazon App Store (Android, Kindle Fire)
- Review on the biggest French android site (FrAndroid)
- Contact the press once again with the news : “More than 250,000 trolls slapped! Join the fun”
- Game of the Week on the biggest French videogame site (jeuxvideo.com)
- App of the day in a French Android app : FreeApps365. This app notifies users every day of the “app of the day”. FreeApps365 had between 100,000 and 500,000 downloads on Google Play (I don’t know the current number of active users). Don’t Feed the Trolls had about 1400 new Android installs this day.
- Contact the press for the third time, because of the “Bears Update” (first big content update with new levels)
I got many other mentions and reviews on small sites, but it didn’t really affect downloads (main quotes of reviews are available on the game page).
Some conclusions from this chart:
- The traffic coming from new players when the game is just released is much bigger on iOS. That probably because of the “New Releases” section in the App Store. There is no such things on Google Play, unfortunately.
- It’s important to get reviews and articles, especially on big sites. However, download/sales spikes drop quickly once the article leaves the front page.
- You can’t really see it on this chart, but Amazon traffic is extermely low (you can see the Android revenue stays close to zero the few days after Amazon release).
- Users of FreeApps365 are really looking for free stuff and didn’t buy many games, but played a lot (big ads spike). Jeuxvideo.com and FrAndroid players on the other hand bought more copies.
Total revenue repartition
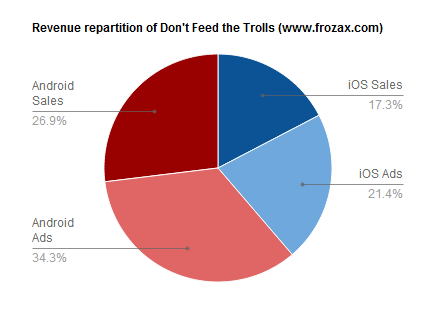
Here is a pie chart showing a more global repartition of revenue.
This is is even easier to read:
- Android brought me more money than iOS. It’s obviously because I got covered by Android only sites/articles.
- Ads brought me more money than sales, both on Android and iOS. However, note that the free version of the game as a lot of content. In fact, I think I shouldn’t have put that much content in the free game. Of course, I can’t tell how reducing free content would have changed this repartition. Also note that without the FreeApps365 mention, sales on Android would bring more money than ads.
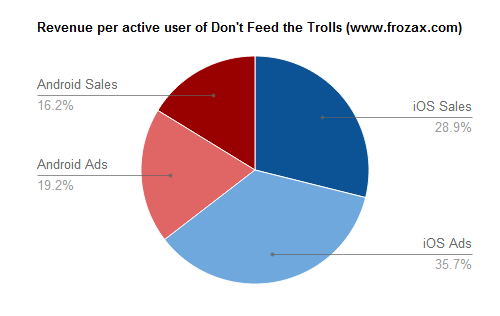
It’s also interesting to take into account the number of players. Here is a new pie chart with revenue per active user. I consider an active user a player that played at least one level (or the tutorial) while being connected (he must have an entry in the leaderboards). I ignored Amazon App store for this one but this is negligible, anyway.
And now, iOS seems to be more valuable.
Conversion Rate
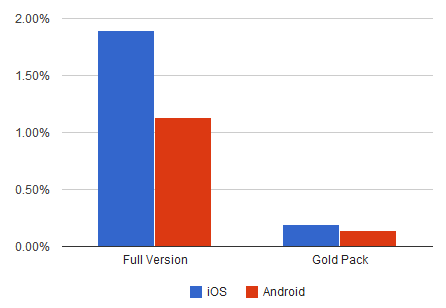
This chart shows the conversion rate of the two in-app purchases, per platform (Full Version is the $0.99 in-app and Gold Pack is the $1.99 one).
Remarks:
- Before Don’t Feed the Trolls appeared on FreeApps365, the conversion ratio for the Full Version on Android was very close to the iOS one.
- As the Gold Pack is only displayed to paying players, the ratio of Gold Pack buyers amongs the Full Version buyers is interesting: 10% on iOS, and 4.69% on Android.
Ads
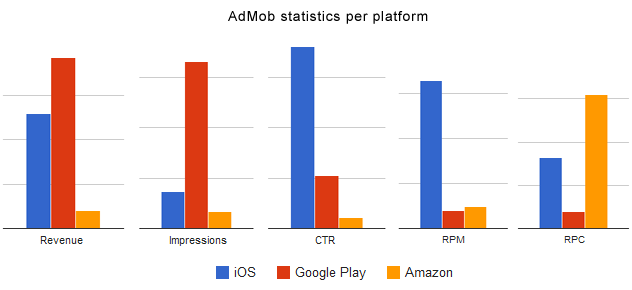
I’m using AdMob on both Android and iOS. I noticed very different statistics depending on the platform and thought it would be interesting to share. I’m not showing numbers, the interesting information here is to see the values relative to the other platforms. Once again, keep in mind that my Amazon stats are quite low.
If you are not familiar with these acronyms, here is a definition:
Impressions: Number of different ads displayed to the user.
CTR: Click-Through Ratio : percentage of ads that are clicked
RPM: Revenue per 1000 impressions
RPC: Revenue per click
We already knew that Android ads brough in more money, but you can see in this graphs that the quantity of impression is much higher too. Therefore, the CTR of iOS is a lot more interesting. I didn’t play Don’t Feed the Trolls much with the ads, but could see that iOS ads were sometimes very targeted (links to another game in the app store for example) compared to some of Androids ads (dental surgery for example).
Conclusion
That’s is for the charts (thanks Google Docs) ! I hope you found interesting information in it. Feel free to share your thoughts, remarks and questions in the comments or on twitter !
Thank you for sharing such information, it shows that’s it is not as easy as people thing to make money with an app !
Thanks for sharing! That’s very interesting.
Hi François,
This information is awesome and very helpful. It gives us a great insight of mobile development and sales. I have actually got “Don’t feed the Trolls” and I believe it is an enjoyable game. I believe that a free app. in a good entry point for future sales with the help of “Ads”.
As a french app. what I will be glad to know is how does it work with the taxes ? Apple takes 30% but what I could see/read in the official docs. is that they actually take almost 40 %. Is that specific to France or is there any other way to recover the 10% ?
Anyway, thanks for the information. Not many people is willing to share such a valuable information and you did. Thanks again.
Hi Cesar, not sure what you’re talking about. Apple takes its 30% from every sales, independant on the source country. Then, local taxes on the revenue applies.
Hi Cesar,
In general, we say that Apple takes 30%. But it varies a bit among countries and also depends on the dollar exchange rate.
As an example, being am a developer from Canada, each $2 app received (from yesterday’s sales): $1.42 from US, $1.20 from the Euro zone, $1.44 from UK and $1.34 from Switzerland.
Note also that with Apple, taxes handling is simple as they manage all the taxes in all countries for us. Taxes are charged to the user on top of the $2, so we receive around 70% of the amount after taxes are deducted.
One thing that I think is unbeliveable is cumulative number of sales/downloads and total income for what looks fun and quick game, nicely polished, and average total income is less then 5$ /day. How many full time working days was needed to produce this game?
Hi Pusti,
It’s very hard to estimate the time spent on this game as I worked evenings mostly but I’d say between 300 and 700 hours (not very precise, I’d need to spend more time on this), plus the time for the art. Yes, very very far from profitable. Once again, I really think the main problem is the visibility. But visibility comes with a outstanding game, not just a “good game”.